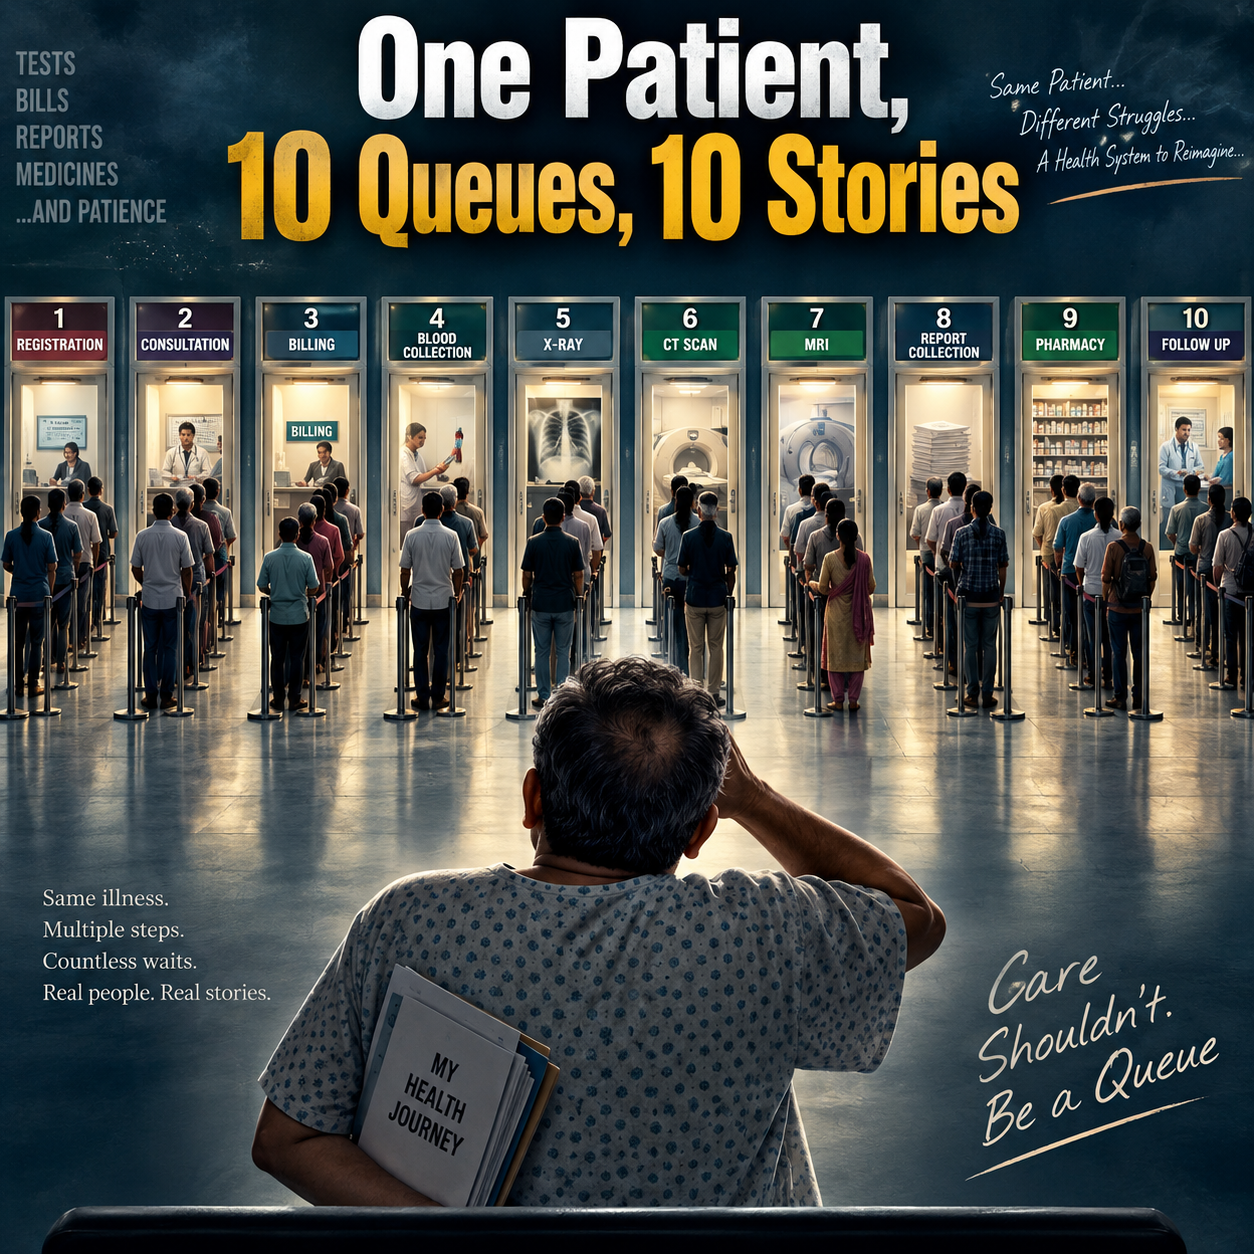
A familiar OPD problem
The consultation may take only a few minutes, but the patient can spend much of the day moving between counters. Registration, blood collection, imaging, report review and pharmacy may each have their own queue. Improving one counter may have little effect on the total visit.
Map the stations the patient actually needs
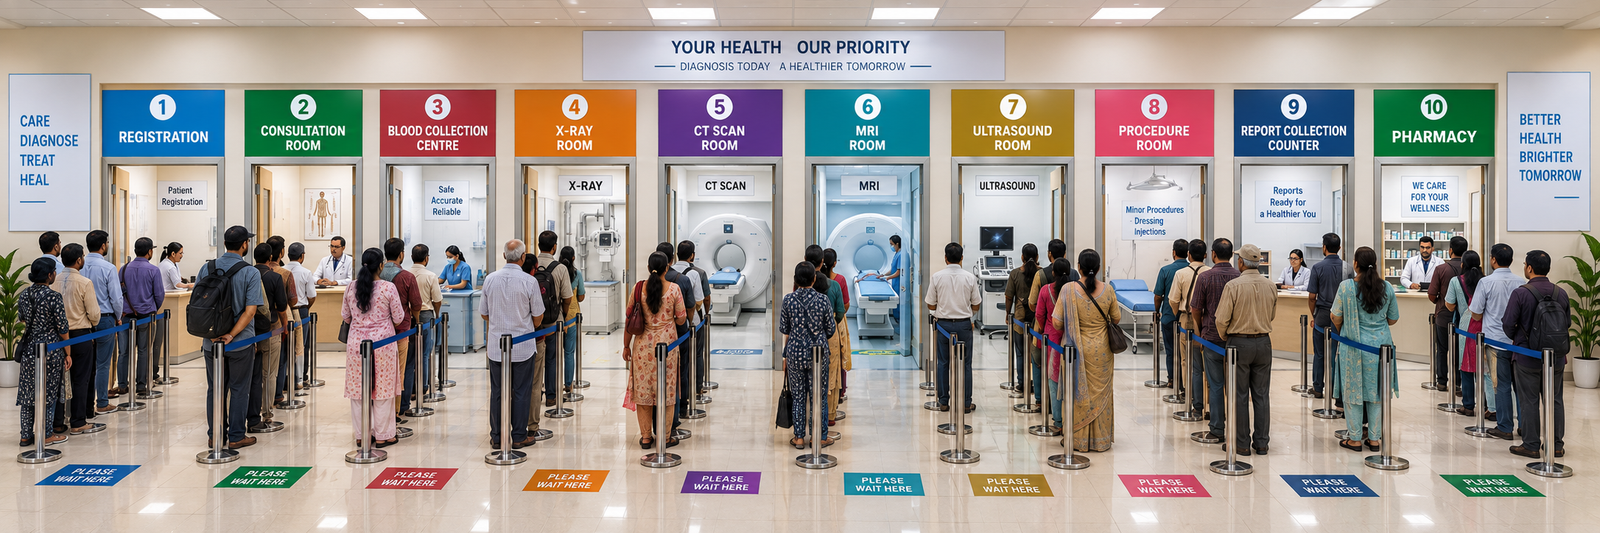
The illustrated map includes registration, consultation, blood collection, X-ray, CT, MRI, ultrasound, the procedure room, report collection and pharmacy. These are possible stations, not a checklist of tests for every patient.
The useful unit to follow is the individual patient’s planned visit. Which services are required, which have been completed and which are holding up the next clinical decision?
What should be recorded?
- Arrival and service times at each required station.
- The investigation or review still pending.
- Whether a result is ready for the treating doctor.
- The next destination and who is responsible for the handover.
- Urgency and priority according to the hospital’s clinical processes.
What a connected view could show
A proposed dashboard could identify a growing imaging queue, patients waiting for a completed report or patients who need to return for review. Once reliable information is available, prediction tools could be evaluated for estimating demand and waiting times. Recording the flow well is useful even before AI is added.
An everyday example
A patient finishes an X-ray but does not know whether to wait outside radiology or return to OPD. A connected workflow would make the report status and next step clear to the patient and team. That handover may be a more useful first improvement than changing the token system.
How to judge whether it helps
Compare total visit time, repeated waiting, missed reviews and patient understanding of the next step. This project describes a patient-flow concept; it does not report measured reductions in waiting time.
Project diagrams and sample outputs